Data Is A People Problem
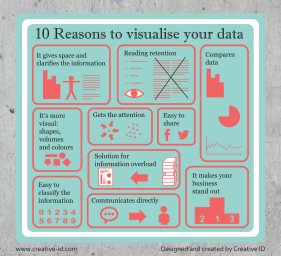
Troy Magennis, an Agile consultant and founder of Focused Objectives who made a keynote presentation at the 2018 Agile conference in San Diego this week. According to Magennis, you can collect all the data in the world and make charts and dashboards, but if people don’t understand what you are trying to tell them — it is not going to make a difference. Magennis opened the keynote with an Agile community call to action: “Having the data isn’t enough. You have to tell the story that leads to the right action.” That means the way in which we present data in order to get understanding conveyed is very important. “Stop using boring plots,” Magennis stated. “That is not going to convince anything to anyone.” Some ways to do that is to present data in a visually compelling way, and compare it to other scenarios that might make it easier to understand. SD Times, August 8, 2018, Agile 2018: Data is a people problem.
KISS (Keep It Simple Stupid) always worked well for me. Using a simple average worked better than the other guy’s Monte Carlo simulation charts, for example. The output of the Monte Carlo simulation caused everyone to ooh and ahh at the solution which amazingly suggested that we only needed to extend our schedule by — wait for it — two weeks to deliver on time. Even though our average time to deliver a product was 3.5 months late, the “visually compelling” graphs clearly showed that we only needed a few more weeks, not the three months my simple average suggested. When did we deliver? Yup, three months late.
I’ve found that “having the data” is about half the effort. The other half is not how to make it compelling. The data was always compelling in my experience because it generally showed that we were making poor decisions. That rarely went over well. The Monte Carlo example worked because the data was tweaked to give an answer everyone could live with, showing only two weeks extra time. When I showed my data, using simple averages, the room didn’t quite explode into outrage, but close. Helping an organization to work through the denial and then on to acceptance was the real challenge. No matter how visually compelling I could have made the plots, the story that was painfully obvious was that, in this case, we were building in at least a three-month slip into every product.
What if we got good data and a compelling story, but no one cared? They usually don’t care because it suggests a course of action different than our current actions. In those cases, I’ve resorted to something equally simple. Just go off and act on the data. Yes, this required extra time and the creative use or acquisition of resources, but the results have almost always been worth it. When we bring it up again and the consensus is that we don’t need it or it won’t work in any case, showing real results using again simple numbers had a huge impact. Are they suddenly happy with us? Often no, but we’ve moved forward on an innovative change and future success.
What are you doing to ensure people get and respond to your insights into how your project could be improved?
