Of Pandemics And Project Management

In any emergency or simply a chaotic situation like the typical software-intensive project, I always looked to find data that helped me anchor my understanding of the situation. A typical project, one that was running late and buggy, could be characterized by many voices raising the alarm, pointing out the problems, and making great claims about the best way to fix things. This cacophony of voices always made it difficult to actually see what was really going on. While all these voices, meetings, e-mails, and PowerPoint slides flew about with great speed throughout the organization, there were also those folks simply trying to do their jobs. In doing their jobs, they generated data that allowed me to see how they were actually doing, rather than being limited to just hearing what others were claiming they were doing.
The typical thing I would do was to research the last few projects and see how long, on average, it took us to complete a project. I would also dig up all the past defects, usually found in a defect database, and compute such things as the average time to repair a defect. Once I had this kind of data, the noise level of everyone yelling about what needed to be done and why always sounded a lot less scary. It was less scary in that I knew when someone, usually one of our best and most respected people, said that we’d resolve the current defect within three days, I knew historically that it would take us a week. The same was true of projects overall. Promises would be made of from twelve months to fifteen months to deliver a new product, but I knew from looking at all past products that we averaged eighteen months to actually deliver a new product. Looking at simple numbers, averages, and trends over time was always a better source of insight on how a project was progressing than all the PowerPoint slides in all the emergency meetings that were called two or three times a day to fail at saving a late and buggy project.
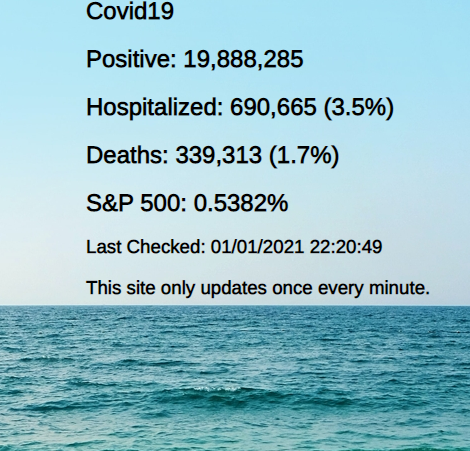
With that said, as the COVID-19 pandemic ramped up in the USA, I made a simple dashboard that showed me just a couple of numbers. These numbers were the reported number of cases, the total number of hospitalizations, the number of deaths, and the S&P500 stock index. I used these numbers to sort out the daily hype and I watched them trend up and then to ultimately begin to taper off.
The death rate in particular was my biggest worry. I originally compared it to such death rates as the number of people who die from the flu, from drug overdoses, from automobile accidents and from various illnesses such as heart disease and cancer. I also came to know that some 7,500 people die per day, on average, in the USA. Having these numbers gave me a sense of how big and dangerous the pandemic really was. I had something to compare it against as it unfolded rather than just hearing various media pundits declare everything from it would kill millions of people in the U.S. in just months to it was going to be no more risky than seasonal influenza.
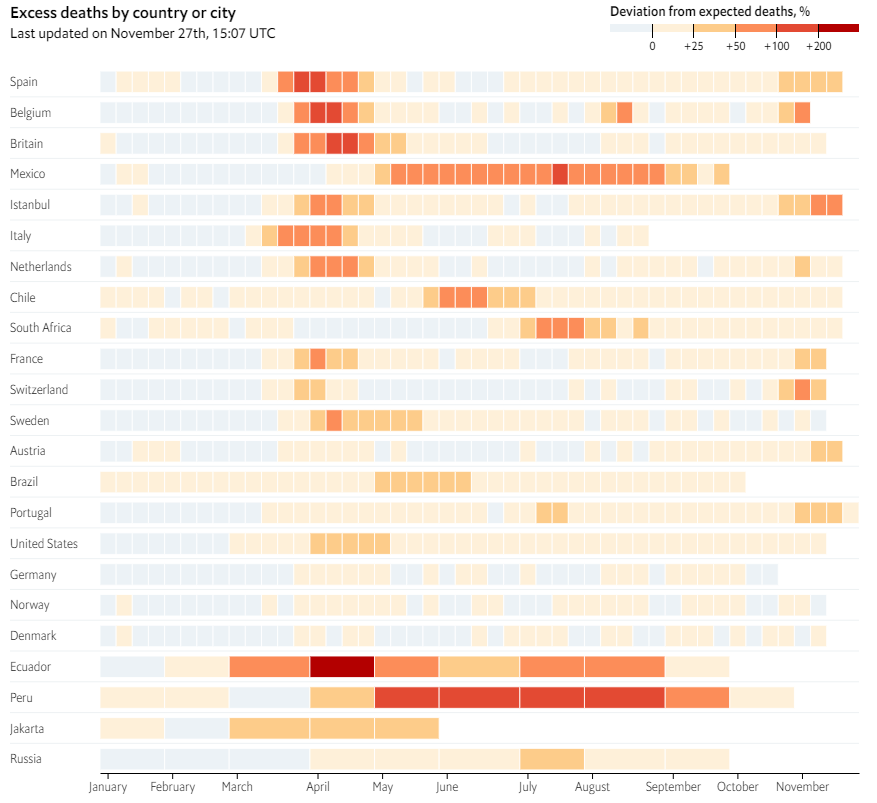
The one statistic that later became my primary touchstone was the excess death rates here in the USA and elsewhere. It was one of the few numbers that seemed to capture the aggregate of what was going on without requiring the difficult judgement of which deaths were caused directly by COVID-19. In all my projects and organizations I’ve managed, I’ve always looked for metrics that were fairly simple to compute and didn’t require a high level of expertise to do so. The excess death rate numbers reminded me of how when using overall averages for, say, a project’s estimated duration, it always struck people as being too simple. In my career, I found that simple overall aggregate numbers were very often more accurate and more predictive of how things were going than all the specialized metrics everyone always thought we needed to use. In all cases, our use of metrics is to help us discipline our judgment and decision-making, especially in a loud and noisy environment that surrounds the typical project or even a worldwide pandemic.
Are you anchoring your understanding of your project or your life on reliable and predictive information?