Five Secrets For Creating Successful Project Management Metrics
A metric is a project management tool that captures an essential aspect of the project or organization and provides insight, allowing us to make rapid and accurate project management decisions. However, we need to develop a deep understanding of our metrics, usually over time, to fully appreciate them and be able to use them effectively.
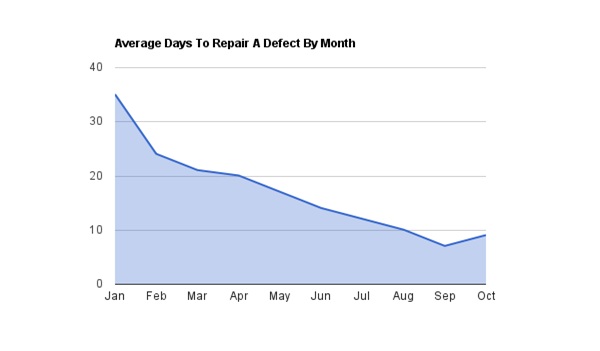
One challenge with producing a metric is to get something that is ideally useful to us every day. One of the most successful metrics I ever computed and used was the average time to fix a quality defect reported in a project.
While we couldn’t predict with any certainty when any one single defect would get fixed, we could predict with rock solid precision when ten or more defects would finally be fixed and in the product. This notion of not being able to tell when a specific defect would be fixed but of accurately predicting when a group of defects would be fixed often startled folks and was considered counter intuitive. While that made it hard all by itself, there was another complication.
The complication was that the average time to fix a defect regularly changed over the life of the development process. When we first started to enter defects, early on in the life cycle of the project, many were entered as reminders of things that eventually needed doing, sometime before the product was shipped. These had a tendency to take a long time to fix, partly because there was not yet any urgency.
As we got down to the last increments of fixes in the product, as issues were found, they got fixed fast. Our speediest fix rates occurred within a month or two of the eventual project completion date (note: I said eventual, not necessarily the planned date). It was also the case that the fix rate, the time to fix a defect, actually increased a bit (flattened out if we look at the trend) just around the time the product shipped. The average time to fix a defect would go from over three weeks at the beginning of the project to under one week at the speediest.
While we found this average time to fix a defect very useful, it had a tendency to confuse more senior management (or anyone who didn’t work with the data daily). When we would get a particularly serious defect reported, the question always went out, “When will it get fixed?” The mandatory answer was “by tomorrow” or “by Friday,” but based upon our averages, we would simply say “we are averaging 7 days to fix a defect, so it should be fixed — along with many of the other defects by next week.” Initially, this kind of answer was considered unacceptable. Many defects got fixed within hours and some within a few days (typical mode was 3 days; the median would be one to two days faster than the average). To estimate “a week” was just not precise or aggressive enough for many people.
Once we started using defect repair averages (and we also reported how long it was taking to fix 95% of any existing defects), defect management went from being very frustrating to being predictable and even a bit boring. A lot of the daily drama and heroics went away when we substituted numbers that just worked for what had been a lot of arm-twisting and insisting that everything could be fixed by “Monday” if the engineers just worked hard enough and worked through the weekend. “Death marches” and management by more meetings were used less often as we observed that they didn’t speed up the defect repair rates.
Here are five not-so-secret lessons learned from developing and using successful metrics:
- Find questions we ask all the time. Avoid using “interesting” or “I always wonder about” questions.
- Find a way to answer the question using already available data. Avoid implementing any additional manual data collection (automatically capturing something already going on is OK).
- Survive the initial disbelief when we finally figure out how to compute the metric and determine our real performance.
- Live with the metric, using it every day for the life of a product. Get to know it, how it varies over time, and how it reflects a fundamental truth of the project or organization.
- Recognize that the metric might change over time and be prepared to adapt our management based on the trend.
A good metric has the quality that it captures a fundamental characteristic of the organization and has a tendency to not change significantly in the short term. In the long term, it very well might change as the organization changes or improves, or it just might be part of the normal cycle of the metric. Once we have a few good project management metrics that capture how we perform, our ability to make commitments, control costs, achieve quality targets, and deliver on time increases dramatically.
What are some of they key project management metrics you rely on every day?
2 thoughts on “Five Secrets For Creating Successful Project Management Metrics”
Comments are closed.

Tonny,
I’ve used and only seen used 5 days and 40 hour weeks. Anything in excess was usually set aside for handling contingencies.
Regards,
Bruce
how many days are there in one week? when doing project management.